使用掩膜绘制直方图
本章节内容是博主网上收集的。当前系列所有demo下载地址:
直接下载:OpenCV-Python-Tutorial-中文版.pdf(P128 使用掩膜)
在线预览
当前系列所有demo下载地址:
https://github.com/GaoRenBao/OpenCv4-Demo
不同编程语言对应的OpenCv版本以及开发环境信息如下:
语言 | OpenCv版本 | IDE |
C# | OpenCvSharp4.4.8.0.20230708 | Visual Studio 2022 |
C++ | OpenCv-4.5.5-vc14_vc15 | Visual Studio 2022 |
Python | OpenCv-Python (4.6.0.66) | PyCharm Community Edition 2022.1.3 |
要统计图像某个局部区域的直方图只需要构建一副掩模图像。将要统计的部分设置成白色,其余部分为黑色,就构成了一副掩膜图像。然后把这个掩膜图像传给函数就可以了。
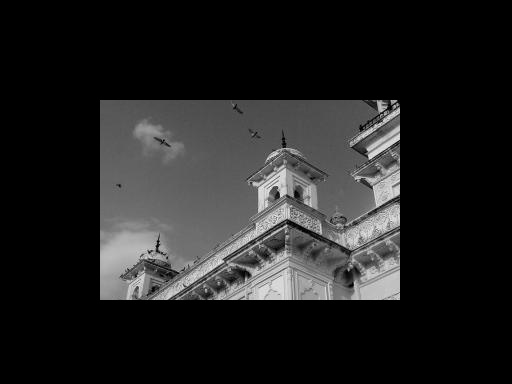
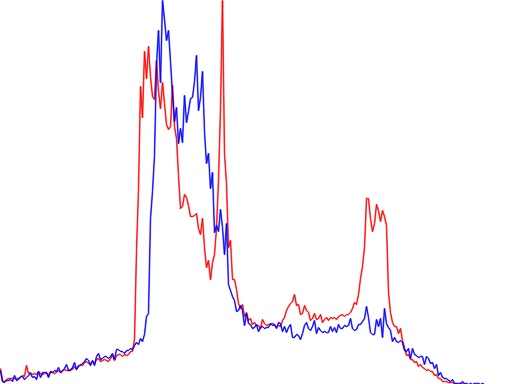
C#版本运行效果及代码如下:


using OpenCvSharp;
using System;

namespace ConsoleApp
{
    internal class Program
    {
        /// <summary>
        /// 绘制直方图
        /// </summary>
        /// <param name="histImage">直方图绘制结果</param>
        /// <param name="histSize">直方图数组大小</param>
        /// <param name="color">线的颜色</param>
        static void DrawHist(Mat histImage, Mat hist, Scalar color)
        {
            var binW = Math.Round((double)histImage.Width / hist.Height);
            //归一化
            Cv2.Normalize(hist, hist, 0, histImage.Rows, NormTypes.MinMax, -1);
            for (int i = 1; i < hist.Height; i++)
            {
                var pt1 = new Point2d(binW * (i - 1), histImage.Height - Math.Round(hist.At<float>(i - 1)));
                var pt2 = new Point2d(binW * (i), histImage.Height - Math.Round(hist.At<float>(i)));
                Cv2.Line(histImage, (Point)pt1, (Point)pt2, color, 1, LineTypes.AntiAlias);
            }
        }

        static void Main(string[] args)
        {
            Mat img = Cv2.ImRead("../../../images/home3.jpg", 0);
            Mat mask = new Mat(img.Size(), MatType.CV_8UC1, new Scalar(0, 0, 0));
            mask.SubMat(100, 300, 100, 400).SetTo(new Scalar(255, 255, 255));

            Mat masked_img = new Mat();
            Cv2.BitwiseAnd(img, img, masked_img, mask);

            // Calculate histogram with mask and without mask
            // Check third argument for mask
            int[] channels = { 0 }; // 通道索引
            int[] histSize = { 256 }; // 直方图中的条目数
            Rangef[] ranges = { new Rangef(0, 256) }; // 像素值范围

            Mat hist_full = new Mat();
            Mat hist_mask = new Mat();
            Cv2.CalcHist(new Mat[] { img }, channels, null, hist_full, 1, histSize, ranges);
            Cv2.CalcHist(new Mat[] { img }, channels, mask, hist_mask, 1, histSize, ranges);

            Mat hist = new Mat(img.Size(), MatType.CV_8UC3, new Scalar(255, 255, 255));
            DrawHist(hist, hist_full, Scalar.Red);
            DrawHist(hist, hist_mask, Scalar.Blue);

            Cv2.ImShow("img", img);
            Cv2.ImShow("mask", mask);
            Cv2.ImShow("masked_img", masked_img);
            Cv2.ImShow("hist", hist);
            Cv2.WaitKey(0);
        }
    }
}
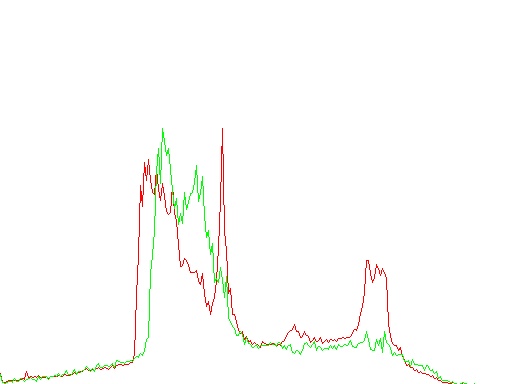
C++版本运行效果及代码如下:

#include <opencv2/opencv.hpp>
#include <string>

using namespace cv;
using namespace std;

/// <summary>
///  绘制直方图
/// </summary>
/// <param name="histImage"></param>
/// <param name="hist"></param>
/// <param name="color"></param>
/// <returns></returns>
void DrawHist(Mat histImage, Mat hist, Scalar color)
{
    int binW = cvRound(histImage.cols / hist.rows);
    //归一化
    normalize(hist, hist, 0, hist.rows, NORM_MINMAX, -1, Mat());
    for (int i = 1; i < hist.rows; i++)
    {
        Point pt1 = Point(binW * (i - 1), histImage.rows - cvRound(hist.at<float>(i - 1)));
        Point pt2 = Point(binW * (i), histImage.rows - cvRound(hist.at<float>(i)));
        line(histImage, pt1, pt2, color, 1, 8, 0);
    }
}


int main()
{
    Mat img = cv::imread("../images/home3.jpg", 0);
    cv::Mat mask = cv::Mat(img.size(), CV_8UC1, cv::Scalar(0, 0, 0));

    std::vector<cv::Point> points;
    points.push_back(cv::Point(100, 100));
    points.push_back(cv::Point(400, 100));
    points.push_back(cv::Point(400, 300));
    points.push_back(cv::Point(100, 300));
    cv::fillConvexPoly(mask, points.data(), points.size(), cv::Scalar(255));

    Mat masked_img;
    cv::bitwise_and(img, img, masked_img, mask);

    // Calculate histogram with mask and without mask
    // Check third argument for mask

    float range[] = { 0, 256 };
    int channels[] = { 0 };
    int hist_size[] = { 256 };
    const float* ranges[] = { range };

    MatND hist_full, hist_mask;
    calcHist(&img, 1, channels, Mat(), hist_full, 1, hist_size, ranges);
    calcHist(&img, 1, channels, mask, hist_mask, 1, hist_size, ranges);

    cv::Mat hist = cv::Mat(img.size(), CV_8UC3, cv::Scalar(255, 255, 255));
    DrawHist(hist, hist_full, Scalar(0, 0, 255));
    DrawHist(hist, hist_mask, Scalar(0,255,0));

    cv::imshow("img", img);
    cv::imshow("mask", mask);
    cv::imshow("masked_img", masked_img);
    cv::imshow("hist", hist);
    cv::waitKey(0);
}
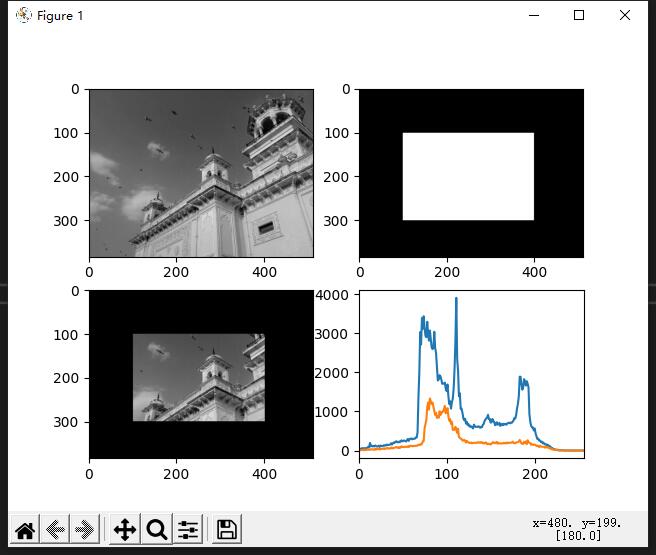
Python版本运行效果及代码如下:
蓝线是整幅图像的直方图,橙线是进行掩模之后的直方图

import cv2
import numpy as np
from matplotlib import pyplot as plt

img = cv2.imread('../images/home3.jpg', 0)

# create a mask
mask = np.zeros(img.shape[:2], np.uint8)
mask[100:300, 100:400] = 255
masked_img = cv2.bitwise_and(img, img, mask=mask)

# Calculate histogram with mask and without mask
# Check third argument for mask
hist_full = cv2.calcHist([img], [0], None, [256], [0, 256])
hist_mask = cv2.calcHist([img], [0], mask, [256], [0, 256])

plt.subplot(221), plt.imshow(img, 'gray')
plt.subplot(222), plt.imshow(mask, 'gray')
plt.subplot(223), plt.imshow(masked_img, 'gray')
plt.subplot(224), plt.plot(hist_full), plt.plot(hist_mask)
plt.xlim([0, 256])
plt.show()


