RGB三色直方图的绘制
视频讲解如下:
在本章节中给大家演示RGB三色直方图的绘制,当前代码同样是在毛星云的代码基础上进行扩展优化的。
当前系列所有demo下载地址:
https://github.com/GaoRenBao/OpenCv4-Demo
不同编程语言对应的OpenCv版本以及开发环境信息如下:
语言 | OpenCv版本 | IDE |
C# | OpenCvSharp4.4.8.0.20230708 | Visual Studio 2022 |
C++ | OpenCv-4.5.5-vc14_vc15 | Visual Studio 2022 |
Python | OpenCv-Python (4.6.0.66) | PyCharm Community Edition 2022.1.3 |
首先呢,我们需要准备一张测试图片。(不想下载工程的童鞋,可直接复制下面的图片和代码)

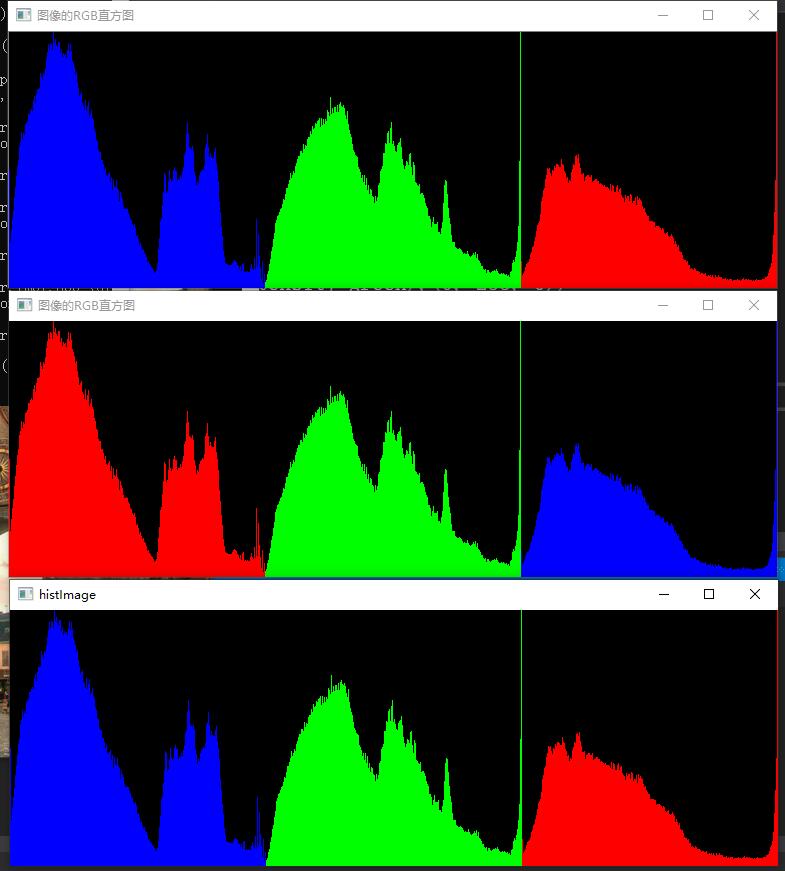
以下从上到下依次是C#、C++、Python三种版本的执行效果对比如下:

C#版本代码如下:
C#版本需要安装“OpenCvSharp4”、“OpenCvSharp4.runtime.win”两个库才行。不然会报错。
如果需要使用“ BitmapConverter.ToBitmap”操作,则需要追加安装“OpenCvSharp4.Extensions”库。
using OpenCvSharp;
using System;

namespace demo
{
    internal class Program
    {
        static void Main(string[] args)
        {
            // 【1】载入素材图并显示
            Mat srcImage = Cv2.ImRead("../../../images/6919.jpg");
            if (srcImage.Empty())
            {
                Console.WriteLine("Could not open or find the image!");
                return;
            }
            Cv2.ImShow("素材图", srcImage);

            //【2】参数准备
            int bins = 256;
            int[] hist_size = { bins };
            Rangef range = new Rangef(0, 256);
            Rangef[] ranges = { range };
            Mat redHist = new Mat();
            Mat grayHist = new Mat();
            Mat blueHist = new Mat();

            int[] channels_r = { 0 };
            //【3】进行直方图的计算(红色分量部分)
            Cv2.CalcHist(new Mat[] { srcImage },//输入的数组
                channels_r, // 通道索引
                null,     // 不使用掩膜
                redHist,  // 输出的目标直方图
                1,        // 需要计算的直方图的维度为2
                hist_size, // 存放每个维度的直方图尺寸的数组
                ranges,   // 每一维数值的取值范围数组
                true,     // 指示直方图是否均匀的标识符,true表示均匀的直方图
                false);   // 累计标识符,false表示直方图在配置阶段会被清零

            int[] channels_g = { 1 };
            //【4】进行直方图的计算(绿色分量部分)
            Cv2.CalcHist(new Mat[] { srcImage },//输入的数组
                channels_g, // 通道索引
                null,      // 不使用掩膜
                grayHist,  // 输出的目标直方图
                1,        // 需要计算的直方图的维度为2
                hist_size,// 存放每个维度的直方图尺寸的数组
                ranges,   // 每一维数值的取值范围数组
                true,     // 指示直方图是否均匀的标识符,true表示均匀的直方图
                false);   // 累计标识符,false表示直方图在配置阶段会被清零

            int[] channels_b = { 2 };
            //【5】进行直方图的计算(蓝色分量部分)
            Cv2.CalcHist(new Mat[] { srcImage },//输入的数组
                channels_b, // 通道索引
                null,     // 不使用掩膜
                blueHist,  // 输出的目标直方图
                1,        // 需要计算的直方图的维度为2
                hist_size,// 存放每个维度的直方图尺寸的数组
                ranges,   // 每一维数值的取值范围数组
                true,     // 指示直方图是否均匀的标识符,true表示均匀的直方图
                false);   // 累计标识符,false表示直方图在配置阶段会被清零

            //-----------------------绘制出三色直方图------------------------

            //参数准备
            double minValue_red, minValue_green, minValue_blue;
            double maxValue_red, maxValue_green, maxValue_blue;

            Cv2.MinMaxLoc(redHist, out minValue_red, out maxValue_red);
            Cv2.MinMaxLoc(grayHist, out minValue_green, out maxValue_green);
            Cv2.MinMaxLoc(blueHist, out minValue_blue, out maxValue_blue);
            int scale = 1;
            int histHeight = 256;
            Mat histImage = new Mat(histHeight, bins * 3, MatType.CV_8UC3);
            histImage.SetIdentity(new Scalar(0));

            //正式开始绘制
            for (int i = 0; i < bins; i++)
            {
                //参数准备
                float binValue_red = redHist.At<float>(i);
                float binValue_green = grayHist.At<float>(i);
                float binValue_blue = blueHist.At<float>(i);
                int intensity_red = (int)Math.Round(binValue_red * histHeight / maxValue_red);  //要绘制的高度
                int intensity_green = (int)Math.Round(binValue_green * histHeight / maxValue_green);  //要绘制的高度
                int intensity_blue = (int)Math.Round(binValue_blue * histHeight / maxValue_blue);  //要绘制的高度

                //绘制红色分量的直方图
                int a1 = histHeight - intensity_red;
                int b1 = histHeight - 1;
                int min1 = a1 > b1 ? b1 : a1;
                int max1 = a1 > b1 ? a1 : b1;
                Cv2.Rectangle(histImage, new Point(i * scale, min1),
                    new Point((i + 1) * scale - 1, max1),
                    new Scalar(255, 0, 0));

                //绘制绿色分量的直方图
                int a2 = histHeight - intensity_green;
                int b2 = histHeight - 1;
                int min2 = a2 > b2 ? b2 : a2;
                int max2 = a2 > b2 ? a2 : b2;
                Cv2.Rectangle(histImage, new Point((i + bins) * scale, min2),
                    new Point((i + bins + 1) * scale - 1, max2),
                    new Scalar(0, 255, 0));

                //绘制蓝色分量的直方图
                int a3 = histHeight - intensity_blue;
                int b3 = histHeight - 1;
                int min3 = a3 > b3 ? b3 : a3;
                int max3 = a3 > b3 ? a3 : b3;
                Cv2.Rectangle(histImage, new Point((i + bins * 2) * scale, min3),
                    new Point((i + bins * 2 + 1) * scale - 1, max3),
                    new Scalar(0, 0, 255));
            }

            //在窗口中显示出绘制好的直方图
            Cv2.ImShow("图像的RGB直方图", histImage);
            Cv2.WaitKey(0);
        }
    }
}
C++版本代码如下:
#include <opencv2/opencv.hpp>
#include <opencv2/imgproc/imgproc.hpp>
using namespace cv;

int main()
{
	//【1】载入素材图并显示
	Mat srcImage;
	srcImage = imread("../images/6919.jpg");
	imshow("素材图", srcImage);

	//【2】参数准备
	int bins = 256;
	int hist_size[] = { bins };
	float range[] = { 0, 256 };
	const float* ranges[] = { range };
	MatND redHist, grayHist, blueHist;
	int channels_r[] = { 0 };

	//【3】进行直方图的计算(红色分量部分)
	calcHist(&srcImage, 1, channels_r, Mat(), //不使用掩膜
		redHist, 1, hist_size, ranges,
		true, false);

	//【4】进行直方图的计算(绿色分量部分)
	int channels_g[] = { 1 };
	calcHist(&srcImage, 1, channels_g, Mat(), // do not use mask
		grayHist, 1, hist_size, ranges,
		true, // the histogram is uniform
		false);

	//【5】进行直方图的计算(蓝色分量部分)
	int channels_b[] = { 2 };
	calcHist(&srcImage, 1, channels_b, Mat(), // do not use mask
		blueHist, 1, hist_size, ranges,
		true, // the histogram is uniform
		false);

	//-----------------------绘制出三色直方图------------------------
	//参数准备
	double maxValue_red, maxValue_green, maxValue_blue;
	minMaxLoc(redHist, 0, &maxValue_red, 0, 0);
	minMaxLoc(grayHist, 0, &maxValue_green, 0, 0);
	minMaxLoc(blueHist, 0, &maxValue_blue, 0, 0);
	int scale = 1;
	int histHeight = 256;
	Mat histImage = Mat::zeros(histHeight, bins * 3, CV_8UC3);

	//正式开始绘制
	for (int i = 0; i < bins; i++)
	{
		//参数准备
		float binValue_red = redHist.at<float>(i);
		float binValue_green = grayHist.at<float>(i);
		float binValue_blue = blueHist.at<float>(i);
		int intensity_red = cvRound(binValue_red * histHeight / maxValue_red);  //要绘制的高度
		int intensity_green = cvRound(binValue_green * histHeight / maxValue_green);  //要绘制的高度
		int intensity_blue = cvRound(binValue_blue * histHeight / maxValue_blue);  //要绘制的高度

		//绘制红色分量的直方图
		rectangle(histImage, Point(i * scale, histHeight - 1),
			Point((i + 1) * scale - 1, histHeight - intensity_red),
			CV_RGB(255, 0, 0));

		//绘制绿色分量的直方图
		rectangle(histImage, Point((i + bins) * scale, histHeight - 1),
			Point((i + bins + 1) * scale - 1, histHeight - intensity_green),
			CV_RGB(0, 255, 0));

		//绘制蓝色分量的直方图
		rectangle(histImage, Point((i + bins * 2) * scale, histHeight - 1),
			Point((i + bins * 2 + 1) * scale - 1, histHeight - intensity_blue),
			CV_RGB(0, 0, 255));

	}

	//在窗口中显示出绘制好的直方图
	imshow("图像的RGB直方图", histImage);
	waitKey(0);
	return 0;
}
Python版本代码如下:
import cv2
import numpy as np

# 【1】载入原图并显示
srcImage = cv2.imread('../images/6919.jpg')
cv2.imshow('srcImage', srcImage)

# 【2】定义变量
size = [256]

# 【3】进行直方图的计算(红色分量部分)
redHist = cv2.calcHist([srcImage], [0], None, size, [0, 256])

# 【4】进行直方图的计算(绿色分量部分)
grayHist = cv2.calcHist([srcImage], [1], None, size, [0, 256])

# 【5】进行直方图的计算(蓝色分量部分)
blueHist = cv2.calcHist([srcImage], [2], None, size, [0, 256])

# -----------------------绘制出三色直方图------------------------
# 参数准备
scale = 1
bins = 256
histHeight = 256
histImage = np.zeros((histHeight, bins * 3, 3), np.uint8)
maxValue_red = cv2.minMaxLoc(redHist)
maxValue_green = cv2.minMaxLoc(grayHist)
maxValue_blue = cv2.minMaxLoc(blueHist)

# 正式开始绘制
for i in range(256):
    binValue_red = redHist[i]  # 直方图组距的值
    binValue_green = grayHist[i]  # 直方图组距的值
    binValue_blue = blueHist[i]  # 直方图组距的值

    intensity_red = round(binValue_red[0] * histHeight / maxValue_red[1])
    intensity_green = round(binValue_green[0] * histHeight / maxValue_green[1])
    intensity_blue = round(binValue_blue[0] * histHeight / maxValue_blue[1])

    # 绘制矩形
    cv2.rectangle(histImage, (i * scale, histHeight - 1),
                  ((i + 1) * scale - 1, histHeight - intensity_red), (255, 0, 0))

    cv2.rectangle(histImage, ((i + bins) * scale, histHeight - 1),
                  ((i + bins + 1) * scale - 1, histHeight - intensity_green), (0, 255, 0))

    cv2.rectangle(histImage, ((i + bins * 2) * scale, histHeight - 1),
                  ((i + bins * 2 + 1) * scale - 1, histHeight - intensity_blue), (0, 0, 255))

# 显示效果图
cv2.imshow('histImage', histImage)
cv2.waitKey(0)
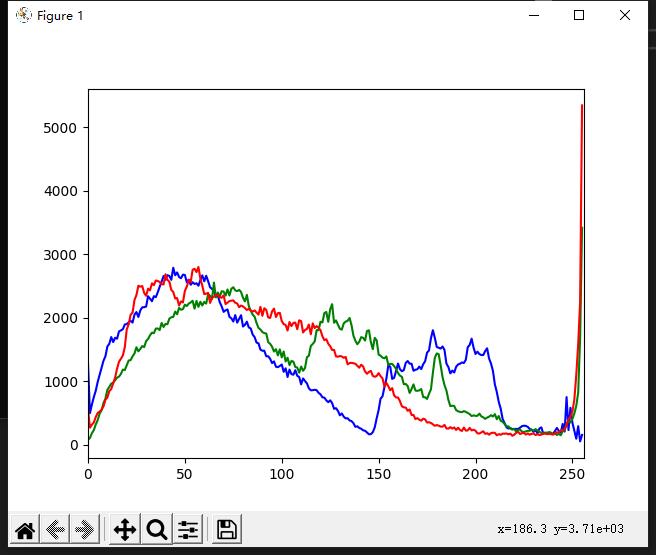
在opencv中,还有一种是直接使用matplotlib库,来查看图像曲线
直接下载:OpenCV-Python-Tutorial-中文版.pdf(P136 绘制直方图)
在线预览

import cv2
import numpy as np
from matplotlib import pyplot as plt

img = cv2.imread('../images/6919.jpg')
color = ('b', 'g', 'r')
# 对一个列表或数组既要遍历索引又要遍历元素时
# 使用内置 enumerrate 函数会有更加直接 优美的做法
# enumerate 会将数组或列表组成一个索引序列。
# 使我们再获取索引和索引内容的时候更加方便
for i, col in enumerate(color):
    histr = cv2.calcHist([img], [i], None, [256], [0, 256])
    plt.plot(histr, color=col)
    plt.xlim([0, 256])
plt.show()


