静态图表显示(曲线图) - (第三十七讲)
视频讲解如下:
源码下载,提取码:z6wo
https://pan.baidu.com/s/17cQirLg2xHgtHHMgNhOOXA
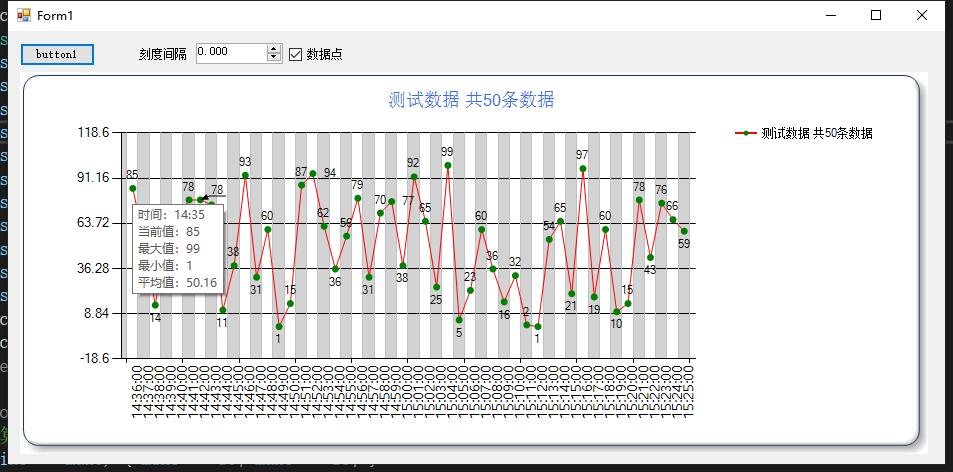
这里给大家演示WinForm环境下如何使用chart控件进行曲线图的静态显示。
目前先整个曲线图的,其他的图表,以后再补充。
效果如下
实现代码如下:
using System;
using System.Collections.Generic;
using System.Drawing;
using System.Linq;
using System.Windows.Forms;
using System.Windows.Forms.DataVisualization.Charting;

namespace WindowsFormsApp
{
    public partial class Form1 : Form
    {
        public Form1()
        {
            InitializeComponent();
        }

        /// <summary>
        /// 初始化图表
        /// </summary>
        /// <param name="maxY">Y轴最大刻度</param>
        /// <param name="minY">Y轴最小刻度</param>
        /// <param name="Interval">X轴间隔</param>
        /// <param name="Type">Y轴数据类型</param>
        /// <param name="name">表名</param>
        private void InitChart(decimal maxY, decimal minY, double Interval, ChartValueType Type, string name)
        {
            #region Series 数据初始化
            this.chart1.Series.Clear();
            Series series = new Series(name);
            series.ChartArea = "C1";
            series.Points.Clear();
            series.Color = Color.Red;
            series.XValueType = ChartValueType.Time; // 这个数据类型一定要和实际的保持一致,否则小弹窗也不会提示
            series.YValueType = Type;
            series.BorderWidth = 1;
            series.MarkerColor = Color.Green;
            series.MarkerSize = 7;
            series.MarkerStyle = checkBox1.Checked ? MarkerStyle.Circle : MarkerStyle.None;
            series.ChartType = SeriesChartType.Line; // Line折线图 Spline 曲线图
            series.IsValueShownAsLabel = true;
            this.chart1.Series.Add(series);

            // 这个一定要放在Add的后面,否则不会显示提示
            this.chart1.Series[0].ToolTip = "时间:#VALX\n当前值:#VALY\n最大值:#MAX\n最小值:#MIN\n平均值:#AVG";
            #endregion

            #region chartArea 数据初始化
            // 计算极限数据
            if (minY == maxY) { minY -= 10; maxY += 10; }
            double min = (double)(minY - ((maxY - minY) * (decimal)0.2));
            double max = (double)(maxY + ((maxY - minY) * (decimal)0.2));

            //定义图表区域、设置图表显示样式
            this.chart1.ChartAreas.Clear();
            ChartArea chartArea = new ChartArea("C1");

            // 允许X、Y轴放大
            chartArea.CursorX.IsUserEnabled = true;
            chartArea.CursorX.IsUserSelectionEnabled = true;
            chartArea.CursorX.Interval = 1D;
            chartArea.CursorX.IntervalOffsetType = DateTimeIntervalType.Minutes;
            chartArea.CursorX.LineColor = Color.Blue;

            chartArea.CursorY.IsUserEnabled = true;
            chartArea.CursorY.AutoScroll = true;
            chartArea.CursorY.IsUserSelectionEnabled = true;
            chartArea.CursorY.Interval = 0D;
            chartArea.CursorY.IntervalOffsetType = DateTimeIntervalType.Minutes;
            chartArea.CursorY.LineColor = Color.Blue;

            chartArea.AxisX.Interval = Interval; // 设置轴的间隔
            chartArea.AxisX.IsInterlaced = true;
            chartArea.AxisX.IsStartedFromZero = false;
            chartArea.AxisX.MajorGrid.LineColor = Color.Silver;
            chartArea.AxisX.MajorGrid.Enabled = true;
            chartArea.AxisX.ScrollBar.Enabled = true;
            chartArea.AxisX.IntervalAutoMode = IntervalAutoMode.FixedCount;
            chartArea.AxisX.IntervalType = DateTimeIntervalType.NotSet;
            chartArea.AxisX.ScrollBar.ButtonStyle = ScrollBarButtonStyles.All;//启用X轴滚动条按钮
            chartArea.AxisX.ScaleView.Scroll(ScrollType.Last);
            chartArea.AxisX.LabelStyle.Format = "HH:mm:ss"; // 设置时间作为X轴
            chartArea.AxisX.LabelStyle.IntervalType = DateTimeIntervalType.Minutes;
            chartArea.AxisX.LabelStyle.Interval = 1;                //坐标值间隔1S
            chartArea.AxisX.LabelStyle.IsEndLabelVisible = false;   //防止X轴坐标跳跃
            chartArea.AxisX.MajorGrid.IntervalType = DateTimeIntervalType.Minutes;
            chartArea.AxisX.MajorGrid.Interval = 1;                 //网格间隔

            //设置图表显示样式
            chartArea.AxisY.Minimum = min; // Y轴最小值
            chartArea.AxisY.Maximum = max; // Y轴最大值
            chartArea.AxisY.IsStartedFromZero = false;
            chartArea.AxisY.MajorGrid.Enabled = true;

            // 背景样式
            //chartArea.BackColor = Color.Red;                       //背景色
            //chartArea.BackSecondaryColor = Color.White;              //渐变背景色
            //chartArea.BackGradientStyle = GradientStyle.TopBottom;   //渐变方式
            //chartArea.BackHatchStyle = ChartHatchStyle.None;         //背景阴影
            //chartArea.BorderDashStyle = ChartDashStyle.NotSet;       //边框线样式
            //chartArea.BorderWidth = 1;                               //边框宽度
            //chartArea.BorderColor = Color.Black;

            this.chart1.ChartAreas.Add(chartArea);
            chartArea.AxisX.LabelStyle.Angle = -90;
            chartArea.AxisX.LabelStyle.Font = new Font("微软雅黑", 10f);
            #endregion

            // 设置标题
            this.chart1.Titles.Clear();
            this.chart1.Titles.Add("n1");
            this.chart1.Titles[0].Text = name;
            this.chart1.Titles[0].ForeColor = Color.RoyalBlue;
            this.chart1.Titles[0].Font = new System.Drawing.Font("Microsoft Sans Serif", 12F);

            // 设置边框
            this.chart1.BackGradientStyle = GradientStyle.TopBottom;
            this.chart1.BorderlineColor = Color.FromArgb(26, 59, 105);
            this.chart1.BorderlineDashStyle = ChartDashStyle.Solid;
            this.chart1.BorderlineWidth = 1;
            this.chart1.BorderSkin.SkinStyle = BorderSkinStyle.Emboss;

        }

        private void button1_Click(object sender, EventArgs e)
        {
            List<datas> tables = new List<datas>();
            // 这个用于生成随机数
            Random rd = new Random();
            // 生成数据
            for (int i = 0; i < 50; i++)
            {
                // 生成数据,X轴是以分钟为单位分割的,所以这里累加的是分钟数
                tables.Add(new datas() { datax = DateTime.Now.AddMinutes(i), datay = rd.Next(1, 100) });
            }

            // X轴刻度间隔
            double Interval = (double)numericUpDown1.Value;
            // 提取最大值,控制Y轴最大刻度
            double max = tables.Max(x => x.datay);
            // 提取最小值,控制Y轴最小刻度
            double min = tables.Min(x => x.datay);

            InitChart((decimal)max, (decimal)min, Interval, ChartValueType.Double, "测试数据 共" + tables.Count.ToString() + "条数据");

            this.chart1.DataSource = tables;
            // X轴数据源
            this.chart1.Series[0].XValueMember = "datax";
            // Y轴数据源
            this.chart1.Series[0].YValueMembers = "datay";
            this.chart1.DataBind();
        }
    }

    public class datas
    {
        /// <summary>
        /// X轴数据
        /// </summary>
        public DateTime datax { get; set; }

        /// <summary>
        /// Y轴数据
        /// </summary>
        public double datay { get; set; }
    }
}